Description
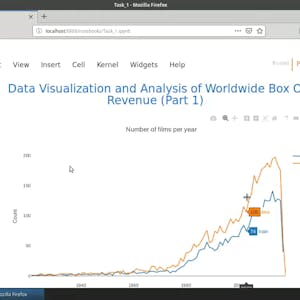
Welcome to this project-based course on Analyzing Box Office Data with Seaborn and Python. In this course, you will be working with the The Movie Database (TMDB) Box Office Prediction data set. The motion picture industry is raking in more revenue than ever with its expansive growth the world over. Can we build models to accurately predict movie revenue? Could the results from these models be used to further increase revenue? We try to answer these questions by way of exploratory data analysis (EDA) in this project and the next. The statistical data visualization libraries Seaborn and Plotly will be our workhorses to generate interactive, publication-quality graphs. By the end of this course, you will be able to produce data visualizations in Python with Seaborn, and apply graphical techniques used in exploratory data analysis (EDA). This course runs on Coursera's hands-on project platform called Rhyme. On Rhyme, you do projects in a hands-on manner in your browser. You will get instant access to pre-configured cloud desktops containing all of the software and data you need for the project. Everything is already set up directly in your internet browser so you can just focus on learning. For this project, you’ll get instant access to a cloud desktop with Python, Jupyter, and scikit-learn pre-installed. Notes: - You will be able to access the cloud desktop 5 times. However, you will be able to access instructions videos as many times as you want. - This course works best for learners who are based in the North America region. We’re currently working on providing the same experience in other regions.
